Refer to the graph below which shows the sales of a particular brand of new car: where I represent
Question: Refer to the graph below which shows the sales of a particular brand of new car:
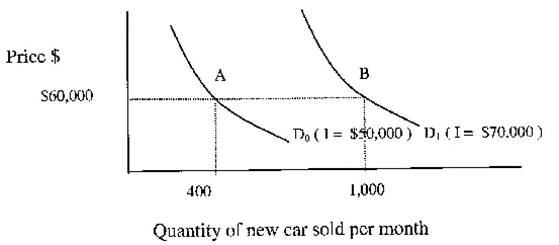
where I represents the average annual household income
i. Calculate the income elasticity of this brand of new car. (3 marks)
ii. Identify the type of goods for this brand of car. (1 marks)
Price: $2.99
Solution: The answer consists of 1 page
Deliverables: Word Document
Deliverables: Word Document
-
 [Solved] Free market. The equations S = 5000 + 200x and D = 9500 - 100x express the supply S and the demand #19003
-
[Solution] Consider Exercise 2 again. Assume that the firms form a cartel to act as a monopolist and maximize t #25411
-
[Solution] Illustrate the least cost point of production for a firm. How does this differ if there are no fixed #28195
-
(Solved) What is the connection between an increase in government purchases and the trade deficit? (Explain h #13704
-
Free Math Help
-
Step-by-Step Math Solutions


 What is the connection between an increase in government purchases and the trade deficit? (Explain h #13704")

