The scatter plot shows the number of sentenced inmates in the United States per 100,000 residents fr
Question: The scatter plot shows the number of sentenced inmates in the United States per 100,000 residents from 2001 through 2005. Also shown is a line that passes through or near the data points.
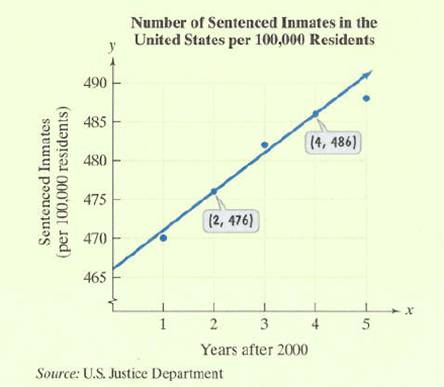
a. Use the two points whose coordinates are shown by the voice balloons to find the point-slope form of the equation of the line that models the number of inmates per 100,000 residents, y, x years after 2000.
b. Write the equation from part (a) in slope-intercept form. Use function notation.
c. Use the linear function to predict the number of sentenced inmates in the United States per 100,000 residents in 2010.
Price: $2.99
Solution: The solution consists of 2 pages
Deliverables: Word Document
Deliverables: Word Document
-
=3x^2-5 from x1 = 6 and x2 = 10. #22915") Solution: Find the average rate of change of f(x)=3x^2-5 from x1 = 6 and x2 = 10. #22915
Solution: Find the average rate of change of f(x)=3x^2-5 from x1 = 6 and x2 = 10. #22915
-
[Solution] If you know the three sides of a triangle, how can you find its area? #7615
-
(See Solution) Simplify: {{((18{a^4)/({b)^{-2}}{c^4}}{12a{{b}^{-3}}{d^2}})}^{-2}} #29275
-
Solution: Find the indefinite integral and check by differentiation. ∫{{t^3}√{{t^4}+1}dt} #9844
-
Math Help
-
Math and Statistics Answers
=3x^2-5 from x1 = 6 and x2 = 10. #22915")

 Simplify: {{((18{a^4)/({b)^{-2}}{c^4}}{12a{{b}^{-3}}{d^2}})}^{-2}} #29275")


