See Solution: Were the variables created correctly and were all variables explained? - #80063
Shelter 1990 Assignment
Criteria for Assignment Evaluation (grading).
- Were the variables created correctly and were all variables explained?
- Did you choose the correct analysis for each situation
- Was each analysis carried out properly and were all necessary steps in the analysis carried out?
- Were the answers correct?
- Were the explanations for the steps correct?
- Were the results written in a clear and accurate fashion, with correct grammar and spelling, and according to APA guidelines?
Assignment Questions
Part 1After creating the two scales and computing age, examine these variables as well as any others used in Part 2 below. Explain their characteristics and the implications of the characteristics (for example, central tendency, dispersion, distribution, etc).
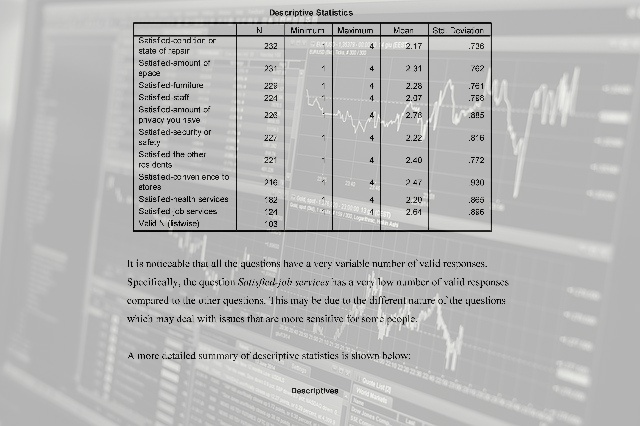
What is the sample size for each variable? Do the sample sizes differ and if so, why?
Part 2- The researchers wonder if men and women have the same levels of satisfaction. Do the analysis to find out and write up your answer, step by step.
- They wonder if marital status (“ns36”) is associated with level of satisfaction.
- The researchers have several predictions:
- Those who are least distressed about not having a regular place to stay (“nb33”) are the most satisfied with the shelter.
- Those who are looking for work (“na155”) are more satisfied than those who are not.
4. The researchers can’t agree on another possible relationship. Several think that one’s satisfaction with the shelter is negatively associated with one’s age. Their colleagues think this is a spurious relationship explained by the extraneous variable level of depression. Please settle this argument.
Instructions for Assignment
The SPSS data file for this assignment is attachment name “shelter1990.” The name of the survey file is “ShelterGuestSurvey.doc” There is no other information. Assume the sample is random. If you happen to do any post hoc tests, assume the variances are equal and use “Tukey HSD.”
You will need to construct two scales and compute one variable. The items for the first scale are on page 4 of the survey --#24 asks about respondents’ satisfaction with 10 items (Variable names “nb26a” through “nb26j”). To get a scale score, respondent must have answered at least 8 out of the 10 items. You should refer to this scale as the “level of satisfaction scale.”
The second scale will consist of items 108 (“ra95”), 109 (“ra120”), and 110 (‘ra121”) on page 17. Respondents who answered all three items will get a scale score. You should refer to this item as the “level of depression scale.”
Calculate and report both Cronbach’s alphas.
You will also need to compute each respondent’s age at the time of the survey. The survey was done in 1990. Note that when the researchers entered the data for year of birth (“born”), they onley entered the last two digits of the year.
Explain every step of the analysis you conduct (what you did and why). This will involve a more extensive report than is usually seen in a “results” section of an article. Use appropriate tables, graphs, and charts in the report. If one or more of the steps involves testing a hypothesis, be sure to state the null hypothesis. Use .05 for your alpha.1 Be careful when interpreting the scores on all variables.
Deliverable: Word Document
 and pdf
 19. A cat uses his of the time. Find the probability - #80212")


