[Solved] Create scatterplot including the trend line, R2 and the regression equation. - #80029
Use the columns labeled Y1 & X1
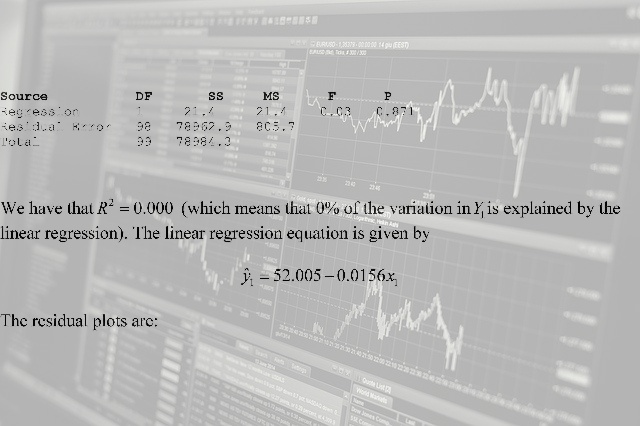
- Create scatterplot including the trend line, R2 and the regression equation.
- Compute the regression and create the diagnostic plots discussed in chapter 8.
- Interpret the regression and scatterplot.
Use the columns labeled Y2 X2
- Create the scatterplot, trend line, R2 and the regression equation.
- Compute the Pearson correlation + p-value.
- Calculate the regression statistics.
- Create diagnostic plots of residuals vs. calculated values.
- Interpret this regression.
Use columns Y3 , X31 , X32
- Create a correlation matrix (no Spearman rank correlation) plus a scatterplot matrix of the variables.
- Compute the regression.
- What is significant in this regression? Compare significance of t-ratios with scatterplot matrix.
- Do a scatterplot of residuals vs. the predicted values of Y3.
- Are the assumptions OK or violated? Defend your answer.
Use columns Y4 & X4.
- Create the scatterplot with trend line, R2 and equation.
- Create a line diagram for both variables.
- Anything look funny?
- Do the regression.
- Create a scatterplot of the residuals vs. the computed values of Y.
- Discuss the assumptions.
Price: $72.95
Solution: The downloadable solution consists of 15 pages, and 921 words
Deliverable: Word Document and pdf
Deliverable: Word Document
and pdf