Solution: An administrator at a high school in has collected data - #80056
|
Weight |
Number of Pushups |
Weight |
Number of Pushups | |
|
149 |
15 |
138 |
22 | |
|
124 |
13 |
149 |
25 | |
|
112 |
18 |
156 |
18 | |
|
134 |
15 |
126 |
18 | |
|
132 |
14 |
153 |
17 | |
|
166 |
18 |
146 |
14 | |
|
149 |
16 |
142 |
15 | |
|
133 |
20 |
126 |
16 | |
|
98 |
8 |
190 |
16 | |
|
124 |
20 |
149 |
13 | |
|
113 |
9 |
151 |
21 | |
|
120 |
20 |
135 |
15 | |
|
150 |
19 |
115 |
18 | |
|
128 |
19 |
125 |
18 | |
|
198 |
21 |
149 |
13 | |
|
132 |
17 |
145 |
19 |
An administrator at a high school in Johnson County has collected data showing how many pushups entering freshmen students can do in a 60-second period prior to taking their first physical education course. Twenty years ago, entering freshmen could do an average of 24 pushups in 60 seconds. The data in the table above were collected for a simple random sample of 32 students in the freshmen class of 240 students at the local high school.
1. Give the mean number of pushups done for this sample of students. Also provide the median, mode, variance, standard deviation and range for this data set.
2. a. Give the mean and standard deviation of the weights of this sample of students.
b. Give a 95% confidence interval estimate of the mean weight of students in the freshmen class at this high school. Do you believe this to be a reliable estimate for the entire class? Why or why not?
3a. We know that in the general population weights are normally distributed. Do the weights for this sample of students appear to be normally distributed? (Be sure to give some type of statistical analysis to explain and support your answer.)
b. One web site gives the ideal mean weight of 14-year-olds as 125 with a standard deviation of 16 pounds. Based on a normally distributed population, what percent of the population of 14-year-olds should weigh more than 140 lbs? Compare this with the percent of students in our sample having weights above 140 lbs. How do they compare? If they are significantly different, why do you think they are different? (Give statistical reasons to support your opinions.)
4a. Does there appear to be a relationship between a student's weight and his or her performance on the pushups test? What is the statistical measure of the strength of this relationship? (Provide a scatter lot and some statistical calculations to help you justify the answer to this question.)
b. Develop an equation that could be used to predict performance on the test based on a student's weight. What is the predicted number of pushups that a student with a weight of 150 can do? In your opinion, how reliable is this predicted score? Why? (Give statistical evidence to support your opinions.)
5. The administrator of the high school wishes to determine if the average number of pushups the entering freshmen can do before completing a physical education course is less than the average of students 20 years ago. Do an appropriate hypothesis test to determine the answer to his question. Use the 0.05 level of confidence.
Deliverable: Word Document
 and pdf
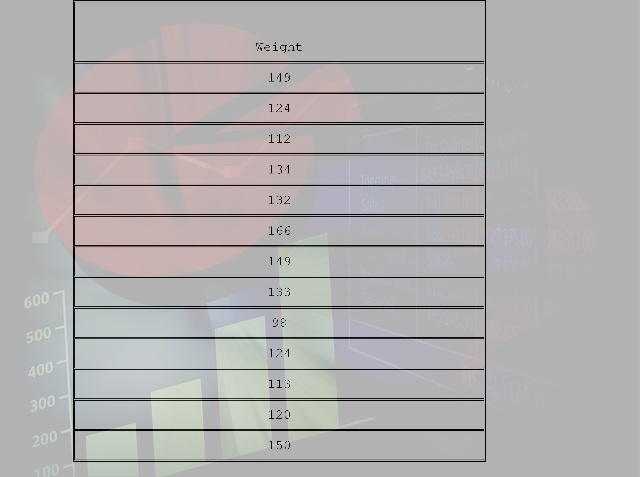

 Find the linear correlation coefficient and use it - #80132")
 \(\sqrt{{{x}^{3}}}=8\). - #80051")

