(Solution) In a study of service quality, a bank manager was interested - #80171
Question 1:
In a study of service quality, a bank manager was interested in knowing how many loan officers to have on hand to make sure that nearly all customers were served with a wait time less than 5 minutes. The manager initiates a study and finds that customers seeking loans arrive on average every 45 minutes. Suppose that a customer just arrived. Using the random number 0.353, simulate how long it will be until the next customer arrives (in minutes) if the inter-arrival times are exponentially distributed. Give your answer to 3 decimal places. The manager also finds that on average 2 customers in every hour arrive in the bank for loan application. Assume the customer arrival follows a Poisson distribution, what is the StatPro formulae if you want to simulate the number of customers next hour?
Solution: We know that customers seeking loans arrive on average every 45 minutes. Since we also assume that the inter-arrival times are exponentially distributed, we have that X, the inter arrival times between customer has an Exponential distribution with parameter \(\lambda =1/45\). The cumulative distribution is computed as
\[F\left( x \right)=\Pr \left( X\le x \right)=\int\limits_{-\infty }^{x}{\frac{1}{45}{{e}^{-s/45}}ds}=\left\{ \begin{aligned}
& 1-{{e}^{-x/45}}\text{ }x\ge 0 \\ & \,\,\,\,\,\,\,0\,\,\,\,\,\,\,\,\,\,\,\,\,\,\,\,\,\,\,\,\,\,x<0 \\\end{aligned} \right.\]
To simulate one inter-arrival time, we need to solve
\[0.353=F\left( x \right)\,\,\Leftrightarrow \,\,\,\,1-{{e}^{-x/45}}=0.353\,\,\,\,\Rightarrow \,\,\,\,\,{{e}^{-x/45}}=0.647\,\,\,\,\]
\[\Rightarrow \,\,\,\,-\frac{x}{45}=\ln \left( 0.647 \right)\,\,\,\,\,\Rightarrow \,\,\,\,\,x=-45\times \ln \left( 0.647 \right)=19.593\text{ minutes}\]
Now, assume that Y represents the customers that will arrive next hour. We know that Y has a Poisson distribution with mean \(\lambda =2\). This means that we use the following syntax in StatPro:
=POISSON_(2)
Question 2:
The time that a tourist waits to board a trolley car on Polk Street in San Francisco is
uniformly distributed from 0 to 5 minutes. As a part of a larger simulation study, the transit authority wants to simulate waiting time. For the first customer, they use a computer to generate the random number 0.461. Use this random number to simulate the waiting time in minutes for the first customers. Give your answer to 3 decimal places.
Solution: Now X has an Uniform distribution on [0, 5]. This means that the cumulative distribution is
\[F\left( x \right)=\left\{ \begin{aligned}
& 1\,\,\,\,\,\,\,\,\,\,\,\,\,x\ge 5 \\ & x/5\,\,\,\,\,\,\,0\le x<5 \\ & 0\,\,\,\,\,\,\,\,\,\,\,\,\,\,x<0 \\\end{aligned} \right.\]
This means that we need to solve:
\[0.461=F\left( x \right)\,\,\,\,\Rightarrow \,\,\,\,0.461=\frac{x}{5}\,\,\,\,\,\Rightarrow \,\,\,\,x=5\times 0.461=2.305\]
(Using StatPro we could do =UNIFORM_(0,5))
Question 3:
The time for Speedy Pizza to deliver a pizza has a mean of 10 minutes, and a standard
deviation of 2.8 minutes. Speedy guarantees that all pizzas will be delivered within 15 minutes or the customer will receive the pizza free. If, delivery time follows a normal distribution, use a random number of 0.817 to simulate on pizza delivery time. Give your answer to 3 decimal places.
Solution: The distribution here is normal, so in order to simulate X, the time of pizza delivery time we use the formula
\[X=\mu +{{\Phi }^{-1}}\left( 0.817 \right)\times \sigma =10+{{\Phi }^{-1}}\left( 0.817 \right)\times 2.8\]
where \({{\Phi }^{-1}}\) corresponds to the inverse cumulative distribution. This means that the simulated value is
\[X=10+{{\Phi }^{-1}}\left( 0.817 \right)\times 2.8=10+0.903991\times 2.8=12.531\]
Note: The value of \({{\Phi }^{-1}}\left( 0.817 \right)\) is calculated using NORMSINV(0.817) in Excel.
Question 4:
Revisit the sweatshirt supplier problem in . last week assignment. Simulate 1000
replications and find which of the following sweatshirt quantities gives the highest expected net profit: 10,000, 10,500, 11,000, 11,500, 12,000, 12,500, 13,000, 13,500, 14,000?
Solution: A simulation with 1000 replications was performed for 10,000, 10,500, 11,000, 11,500, 12,000, 12,500, 13,000, 13,500 and 14,000 t-shirts (See the attach spreadsheet). The summary table of the results is shown below:
|
T-Shirts |
Expected Profit |
|
10,000 |
$151,092.5 |
|
10,500 |
$152,890.0 |
|
11,000 |
$154,265.0 |
|
11,500 |
$153,167.5 |
|
12,000 |
$155,007.0 |
|
12,500 |
$153,335.0 |
|
13,000 |
$152,445.0 |
|
13,500 |
$149,700.0 |
|
14,000 |
$146,192.5 |
The maximum profit was achieved with 12,000 T-shirts.
Yield management (revenue management) is a set of comprehensive business policies
developed to maximize profit for the capacity-constrained service industries such as hotel, rental-car, and cruise lines. In fact, airlines were the first to coin the term, yield management, after deregulation permitted airlines to set their own prices to maximize yield from each of their flights.
Once a flight has departed, the potential revenue from an empty seat is lost forever.
Because of the perishable nature of, airline seats, yield management attempts to allocate the fixed capacity of seats on a flight to match the potential demand in the most profitable manner. We take a look at a common practice of the yield management in the airline industries: the discount-fare policy.
Discount fare policy
Julie Michaels is responsible for yield management at Tilde Airline (TA). During the
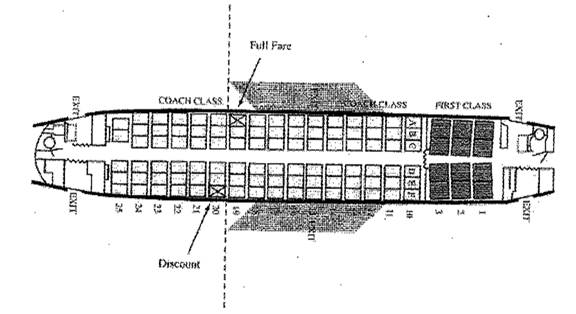
recent economic slump, she discovered that airplanes on its Salt Lake-to-Las Vegas route have been flying with more empty seats than usual. Examining the recent data, Julie found that the demand for full-fare tickets appears to have a normal distribution, with a mean of 60 and a standard deviation of 15. To stimulate demand, Julie has decided to offer a special, nonrefundable, 14-day advance-purchase "gambler fare" for only $98 on a round-trip ticket. Since the gambler fare is very attracting to gamblers (or risk-seeking people), she is confident that all available discount gambler-fare seats will be sold 14 days prior. The Boeing 737 used by TA has a capacity of 95 passengers in coach cabin as shown in the graph below.
Julie knows that she needs to limit the number of seats that are sold at the discount fare in
order to sell full-fare tickets ($138 round-trip) to passengers who have not made advance travel plans. Set up a simulation model with 1,000 replications to answer the following two questions.
Question 5.
If Julie decides to reserve 70 full-fare seats as her reservation policy, what is the average
revenue of the flight on the Salt Lake — Las Vegas route?
Solution: 1000 replications were performed for the case of 70 full-fare ticket. Let X be the random number of full-fare clients. The random revenue is
\[R=\left\{ \begin{aligned}
& 138X+98\times 25\text{ if }X<70 \\ & 138\times 70+98\times 25\,\,\,\,\,\,\,\,\,\text{if }X\ge 70 \\\end{aligned} \right.\]
Simulating the process 1000 times, we get that the expected revenue is $10,491.71.
Question 6.
How many of the full-fare seats that Julie needs to reserve (i.e., the optimal reservation
policy) in order to maximize the average revenue of each flight on this route: 30, 40, 50, 60, or 70 seats?
Solution: Now, 1000 replications were performed for the case of F full-fare ticket, for F = 30, 40, 50, 60, 70. Let X be the random number of full-fare clients. The random revenue is
\[R=\left\{ \begin{aligned}
& 138X+98\times \left( 95-F \right)\text{ if }X<F \\ & 138\times F+98\times \left( 95-F \right)\,\,\,\,\,\,\,\,\,\,\,\text{if }X\ge F \\\end{aligned} \right.\]
Simulating the process 1000 times, we get that the following table with expected revenues:
|
Full Fare Reservation |
Expected Revenue |
|
30 |
$10,493.44 |
|
40 |
$10,830.93 |
|
50 |
$11,015.65 |
|
60 |
$10,931.54 |
|
70 |
$10,494.71 |
which means that the highest revenue is achieved with 50 full fare seats.
Deliverable: Word Document
 and pdf
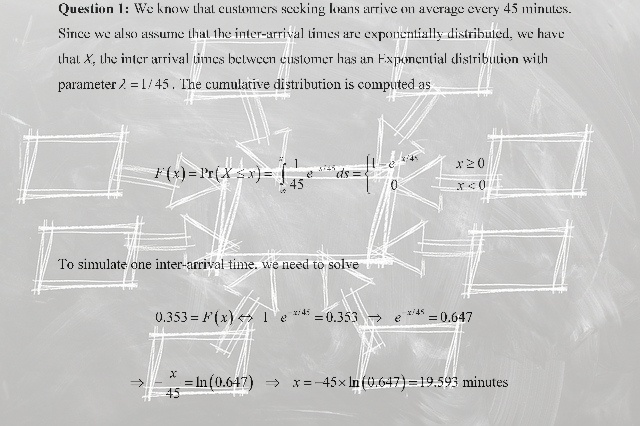


 Gather a list of the names of all of the stocks that - #80217")
