Practicing Descriptive Statistics
The best way of learning about how to solve Descriptive Statistics problems properly is to PRACTICE. Here you have a couple of step-by-step examples, exclusively for our subscribers
Question 1: HiEd has held 5 recruiting visits around the region so far this year. The number of high school seniors attending these events is given below.
10 15 20 35 20
The average number of high school seniors attending an event is 20.
a. Determine the range for this sample.
b. Determine the standard deviation.
Solution: (a) The range is computed as:
\[Range=Max-Min = {35}-{10} = {25}\]
(b) Finally, the following table shows the required calculations needed to compute the standard deviation:
|
X |
X² |
|
|
10 |
100 |
|
|
15 |
225 |
|
|
20 |
400 |
|
|
35 |
1225 |
|
|
20 |
400 |
|
|
Sum = |
100 |
2350 |
The sample variance is
\[{{s}^{2}}=\frac{1}{n-1}\left( \sum{X_{i}^{2}}-\frac{{{\left( \sum{{{X}_{i}}} \right)}^{2}}}{n} \right)=\frac{1}{5-1}\left( 2350-\frac{{{\left( 100 \right)}^{2}}}{5} \right)=87.5\]and also we find that the standard deviation is computed as
\[s=\sqrt{87.5}=9.3541\]
,p> Question 2: The Financial Times/Harris poll is a monthly online poll of adults from six countries in Europe and the united states. The poll conducted in January 2008 included 1015 adults. One of the questions asked was "How would you rate the federal bank in handling the credit problems in the financial markets?" Possible responses were excellent, good, fair, bad, and terrible. The 1015 responses for this question can be found in the data file named fedbank.a. Construct a frequency distribution.
b. Construct a percent frequency distribution.
c. Construct a bar chart for the percent frequency distribution.
d. comment on how adults in the united states think the federal bank is handling the credit problems in the financial markets.
e. In Spain, 1114 adults were asked, 'How would you rate the European central bank in handling the credit problems in the financial markets?" The percent frequency distribution obtained is as follows.
Rating Percent Frequency
excellent 0
good 4
fair 46
bad 40
terrible 10
Compare the results obtained in Spain with the results obtained in the United States.
Solution: (a) The following is obtained:
|
Rating |
Frequency |
|
Bad |
244 |
|
Excellent |
20 |
|
Fair |
528 |
|
Good |
101 |
|
Terrible |
122 |
|
Grand Total |
1015 |
(b) Now we get:
|
Rating |
Frequency |
Percent Frequency |
|
Bad |
244 |
24.04% |
|
Excellent |
20 |
1.97% |
|
Fair |
528 |
52.02% |
|
Good |
101 |
9.95% |
|
Terrible |
122 |
12.02% |
|
Grand Total |
1015 |
100.00% |
(c) The following is obtained:
(d) In a big majority, US adults think the fed is handling it in a fair way.
(e) In Spain most adults think that the handling has fair and bad.
Question 3: For the following set of scores:
3, 7, 6, 5, 5, 9, 6, 4, 6, 8, 10, 2, 7, 4, 9, 5, 6, 3, 8
a. Construct a frequency distribution table.
b. Sketch a polygon showing the distribution.
c. Describe the distribution using the following characteristics:
(1) What is the shape of the distribution?
(2) What score best identifies the center (average) for the distribution?
(3) Are the scores clustered together, or are they spread out across the scale?
Solution: (a) The minimum and maximum values obtained from the data provided are
Min = 2
Max = 10
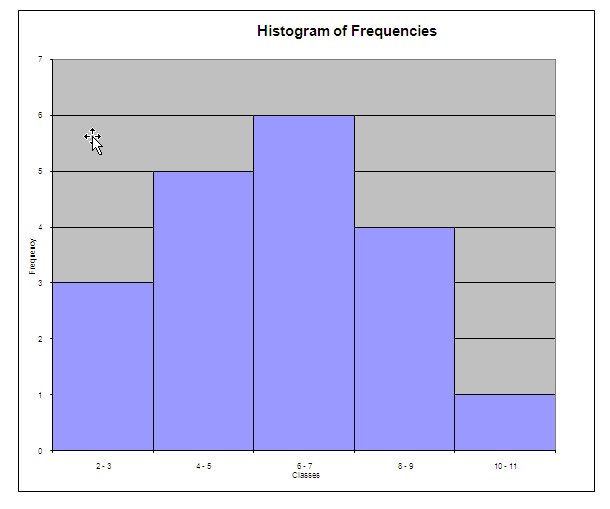
Based on this, we choose the lowest class to be 2. The minimum class width is (10 – 2)/5 = 1.6, so we choose a class width of 2. Hence, the respective lower class limits are computed as Li = 2 + 2*i. The following table shows the frequency table:
|
Classes |
Frequency |
Rel. Frequency |
Cumulative Frequency |
Rel. Cumulative Frequency |
|
2 - 3 |
3 |
0.158 |
3 |
0.158 |
|
4 - 5 |
5 |
0.263 |
8 |
0.421 |
|
6 - 7 |
6 |
0.316 |
14 |
0.737 |
|
8 - 9 |
4 |
0.211 |
18 |
0.947 |
|
10 - 11 |
1 |
0.053 |
19 |
1 |
The following histogram is obtained
(b) The following frequency polygon is obtained
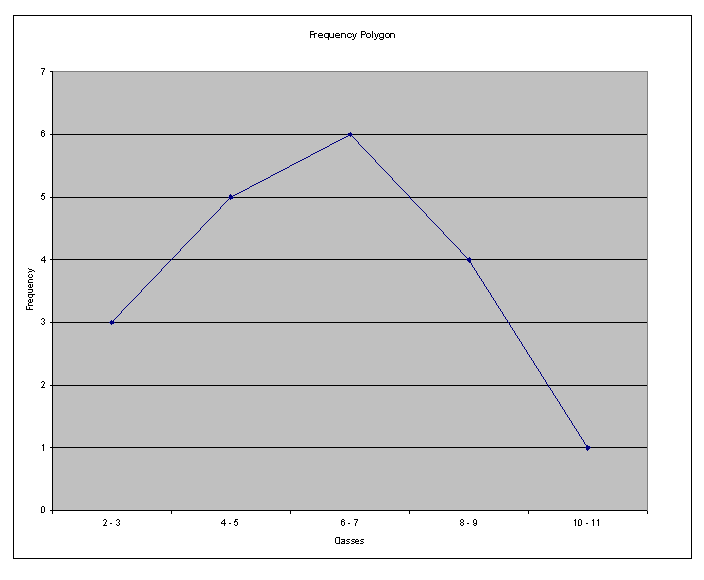
(c) (1) The distribution is approximately symmetric.
(2) Since the distribution is roughly symmetric, the mean would be the best measure of central tendency.
(3) The scores are relatively spread across the scale, even though they a bit concentrated about the center.