Using the following data and the Descriptives function in SPSS to answer each of the following quest
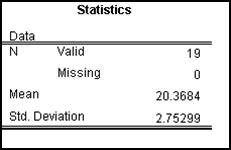
Question: Using the following data and the Descriptives function in SPSS to answer each of the following questions:
21 25 21 19 16 18 19 19 16 24 21 21 17 26 20 23 20 21 20
For a two-tailed test or nondirectional hypothesis, the researcher is interested in results that occur in either tail of the normal curve (e.g., they are interested in extreme high scores and extreme low scores). Therefore, when using the 5% criteria to judge the likelihood of a score, the researcher identifies the score that divides the curve into three parts (the first part containing the lower 2.5% of scores, the second part containing the middle 95% of the scores, and the third part containing the upper 2.5% of the scores). What value of z separates the normal curve into these three sections? (You may need to refer to Table B.1).
Deliverable: Word Document

-
 [Solved] Using the following data and the Descriptives function in SPSS to answer each of the following quest #17645
-
[Solution] A new potato chip is to be test-marketed by giving a free sample to randomly selected customers and #19864
-
(See Solution) The volumes of soda in quart soda bottles are normally distributed with a mean of 32.3 oz. and a sta #413
-
[Solution] As noted, when two population means are equal, the estimated standard error for the independent meas #12905
-
Math Help
-
Math Solved Problems


 The volumes of soda in quart soda bottles are normally distributed with a mean of 32.3 oz. and a sta #413")


