The table below shows the per capita (per person) revenue and expenditure for selected states in a r
Question: The table below shows the per capita (per person) revenue and expenditure for selected states in a recent year.
| State | Per capita Revenue ($) | Per Capita Expenditure ($) |
| Kentucky | 4561 | 4261 |
| , Louisiana | 3985 | 3671 |
| Minnesota | 5243 | 4937 |
| Montana | 4668 | 4473 |
| South Carolina | 4152 | 4451 |
| Texas | 3066 | 3027 |
| Vermont | 5127 | 5499 |
| Wyoming | 5830 | 5355 |
The scatter plot, least squares regression line, and residual plot are shown below.
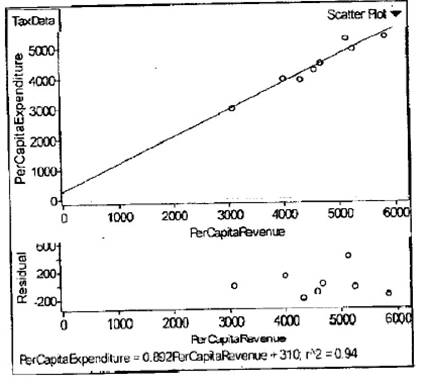
(A) Consider the information for Per Capita Revenue vs. Per Capita Expenditure. Is the model proposed by the linear regression line a reasonable model? Explain.
(B) The residual with the largest absolute value is for Vermont. What is the residual value for this state? Show your work. Explain what it means in terms of the model.
(C) Ohio spent $4,204 per person during this same year. According to this model, about how much did they collect per capita?
(D) In this same year Alaska collected $9,757 per capita in revenue and spent $11,155 per person. Does this information follow the trend? Explain.
Type of Deliverable: Word Document

-
 [Solution] In a recent study, researchers evaluated the gender patterns of 4,208 families with exactly 2 childr #12415
-
(See Solution) A company is investigating its average manufacturing costs per item produced. It has chosen a random #12529
-
[Solved] 18. Find the method of moments estimate for.. if a random sample of size n is taken from the expon #23928
-
[Solution] Exercises 40 - calculate mean, med, mode, sd, var, as well as construct the boxplot and comment on t #14857
-
Math Help
-
Math Solutions

 A company is investigating its average manufacturing costs per item produced. It has chosen a random #12529")


