Test scores for the 25 members of the general math class were as follows: 72, 59, 91, 64
Question: Problem 4) Test scores for the 25 members of the general math class were as follows:
72, 59, 91, 64, 86, 53, 98, 77, 85, 62, 54, 71, 85,
93, 66, 78, 87, 69, 68, 71, 75, 66, 63, 74, 79
Create a relative frequency histogram using ten-point interval to show the distribution of the scores.
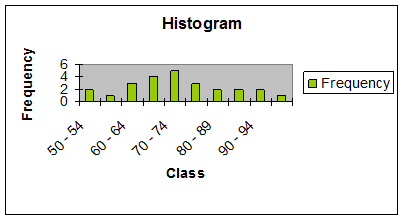
| Class | Frequency |
| 50 - 54 | 2 |
| 55 - 59 | 1 |
| 60 - 64 | 3 |
| 65 - 69 | 4 |
| 70 - 74 | 5 |
| 75 - 79 | 3 |
| 80 - 89 | 2 |
| 85 - 84 | 2 |
| 90 - 94 | 2 |
| 95 - 98 | 1 |
Price: $2.99
Solution: The solution consists of 2 pages
Deliverables: Word Document
Deliverables: Word Document
-
 [Solution] The data below show the average daily high temperature for Chicago, Illinois, for twelve #878
-
[Solution] Complete the following: (30 pts - 10 pts. ea.) a. Select a variable. Compare the mean of the variabl #16464
-
[Solved] Let's say we have a sample of 36 cola cans that contain an average of12.29 oz. Let's assume that we #28745
-
Solution: Complete Exercise 7.5: Heights of 10-year-old boys in Chapter 7. Be sure to answer questions (a), (b #19874
-
Math and Statistics Calculator
-
Math Solved Problems

 a. Select a variable. Compare the mean of the variabl #16464")

, (b #19874")

