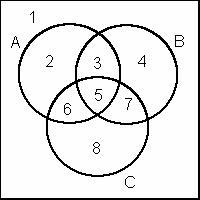
Given the following diagram where A, B and C represent variance of three different variables, assumi
Question: Given the following diagram where A, B and C represent variance of three different variables, assuming you have data available for each variable, how would you go about calculating the percent area corresponding to areas 3, 6 and 7?
Price: $2.99
Solution: The solution consists of 1 page
Deliverable: Word Document
Deliverable: Word Document
-
 With regards to hypothesis testing, describe what each of the following means conceptually and how y #7490") (See Solution) With regards to hypothesis testing, describe what each of the following means conceptually and how y #7490
(See Solution) With regards to hypothesis testing, describe what each of the following means conceptually and how y #7490
-
(See Solution) Assume the annual mean return on Disney stock is around 15% and the annual standard deviation is aro #17197
-
[Solution] The diameters of a wooden dowel produced by a new machine are normally distributed with a mean of 0. #20392
-
Solution: Test Scores. A student scores 60 on a mathematics test that has a mean of 54 and a standard deviatio #25739
-
Free Math Help
-
Math and Statistics Answers
 With regards to hypothesis testing, describe what each of the following means conceptually and how y #7490")
 Assume the annual mean return on Disney stock is around 15% and the annual standard deviation is aro #17197")


