The following computer output shows a cross-tabulation of frequencies and provides frequency number
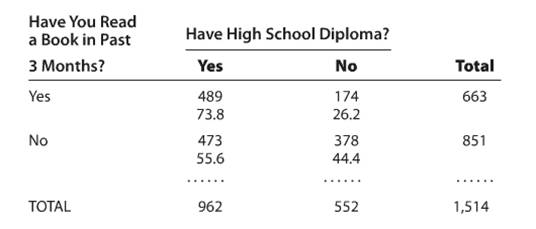
Question: The following computer output shows a cross-tabulation of frequencies and provides frequency number N) and row R) percentages.
a. Interpret this output including a conclusion about whether or not the row and column variables are related.
b. Critique the way the analysis is presented.
c. Draw a pie chart indicating percentages for having read a book in the past three month for those with and those without high school diplomas.
Price: $2.99
Solution: The solution consists of 3 pages
Deliverables: Word Document
Deliverables: Word Document
-
 What conditions suggest that a ratio variable should be transformed (recoded) into a dichotomous (tw #27621") (See Solution) What conditions suggest that a ratio variable should be transformed (recoded) into a dichotomous (tw #27621
(See Solution) What conditions suggest that a ratio variable should be transformed (recoded) into a dichotomous (tw #27621
-
[Solved] Q18. What is the relative frequency of the event when “-1.23 < z < 1.77” (the relative frequency of #25479
-
[Solved] A randomized block design has five different age groups as blocks, and members of each block have be #4919
-
[Solved] To test the effectiveness of a treatment, a sample of n = 25 people is selected from a normal popula #23545
-
Math and Statistics Calculator
-
Step-by-Step Math Solutions
 What conditions suggest that a ratio variable should be transformed (recoded) into a dichotomous (tw #27621")


