Classified ads in a city newspaper listed several used Toyota Corollas for sale. The above scatter p
Question: Classified ads in a city newspaper listed several used Toyota Corollas for sale. The above scatter plot displays age (X) and advertised price (Y). (6 pts)
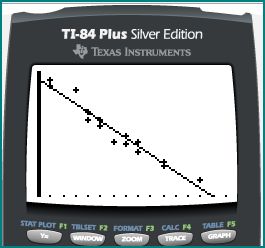
a. Describe the association between Age and Price of a used Corolla.
b. Identify the direction (positive or negative) of the correlation depicted in the scatterplot above.
Positive Negative No Direction
c. r2 = .944. What’s the correlation coefficient? ______________
d. The above scatter plot displays age (X) and advertised price (Y).
If you put “age” onto the Y-axis, and you put “price” onto the X-axis, would the correlation coefficient change? Yes or No
e. The above scatter plot displays age (X) and advertised price (Y).
If you put “age” onto the Y-axis, and you put “price” onto the X-axis, would the equation for the line of regression change? Yes or No
f. Does the scatterplot and line of regression above show that age causes price to come down in the Corolla? Yes or No
Deliverables: Word Document

-
 of 53 men who qualified for the men’s alpine downhill race was #25041") Solution: a. The mean time (in seconds) of 53 men who qualified for the men’s alpine downhill race was #25041
Solution: a. The mean time (in seconds) of 53 men who qualified for the men’s alpine downhill race was #25041
-
(Solved) Is the frequency of smoking among the sample of teenagers different from the national average of 3 c #28773
-
[Solution] The Summa is a new sports car. An extended transmission warranty is available for $1500 that will re #5135
-
[Solved] A college admissions officer for an M.B.A. program has determined that historically, candidates hav #9719
-
Math and Statistics Calculator
-
Math Solved Problems
 of 53 men who qualified for the men’s alpine downhill race was #25041")
 Is the frequency of smoking among the sample of teenagers different from the national average of 3 c #28773")


