A dairy products firm sells two types of products: “Hi-fat” and “Solid”. The profit for Hi-fat and S
Question:
A dairy products firm sells two types of products: “Hi-fat” and “Solid”. The profit for Hi-fat and Solid are $250 and $150 per unit respectively. The firm has a total production capacity of 500 units per week regardless of product type. Electronic sales records show that each week, the firm never sells more than one-half as many Hi-fat units as it does Solid units. The firm must produce at least 350 units of Solid per week as per an agreement with its farmer suppliers. The firm wants to find out how many units of each type of product it should make per week in order to maximise profit The Answer Report and the Sensitivity Report from Excel Solver are shown below.
Answer Report
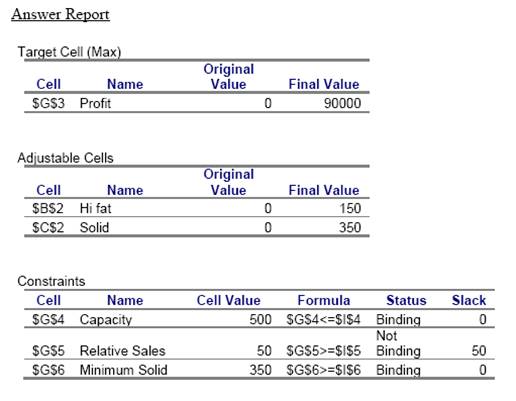
A. From the Answer Report
a. What are the decision variables and what are their optimal values?
b. Explain how the Final Value of Profit Value of $90000 is obtained.
c. Explain how a Slack value for the Relative Sales constraint of 50 is obtained (I am not looking for an interpretation of this value; explain how the value of 50 can be derived from other entries in the Answer Report?)
B. On a graph:
a. Plot the constraints on the graph paper. Label the lines on the graph. Identify the feasible region on the graph by drawing light diagonal lines through the feasible region.
b. Show the $90000 iso-profit line on the graph and explain in words below why that is the optimal profit value.
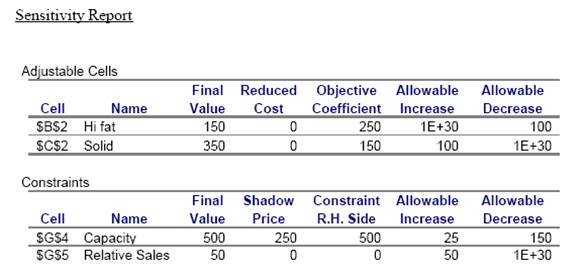
B. From the Sensitivity Report
a. Explain in words what the Shadow Price of 250 for the Capacity constraint means.
b. Explain in words what the “Allowable Increase” of 25 for this constraint means.
c. On the graph from part 2, plot the Capacity constraint at a new value of 550.
d. From the graph, explain why the shadow price of 250 does not apply with the new Capacity constraint.
Type of Deliverable: Word Document

-
 Solution: A local authority housing stock consists of three types of house construction; X, Y and Z, comprisin #12924
-
[Solved] A normally distributed population has m = 70 and s = 15. a. For this population, what proportion of #7834
-
Statistics - Testing hypothesis #12922
-
[Solved] A study is designed to determine the effect of an office-training course on typing productivity. Ten #20349
-
Math Homework Help
-
Math and Statistics Answers


