Suppose a modest relationship exists between two variables in a population. Would it be more likely
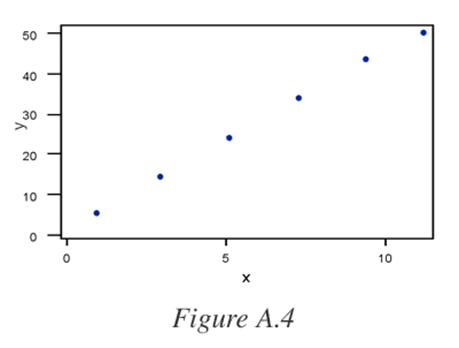
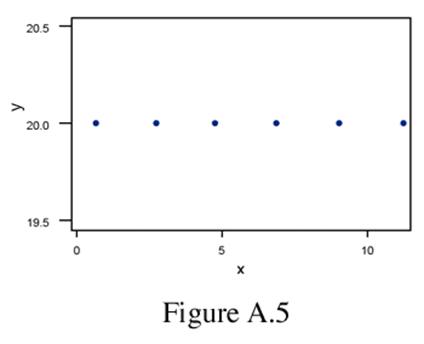
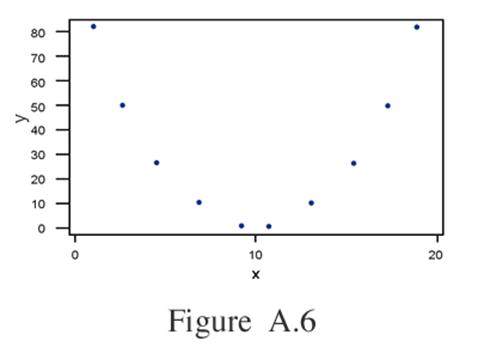
Question: Which of the following graph(s) would represent a correlation of 0?
|
|
|
Price: $2.99
Solution: The solution consists of 2 pages
Deliverables: Word Document
Deliverables: Word Document
-
 at a restau #9703") [Solution] A regression equation that describes the relationship between the amount of the bill ($) at a restau #9703
[Solution] A regression equation that describes the relationship between the amount of the bill ($) at a restau #9703
-
(See Solution) Find the value of {{z}_{alpha /2}} that corresponds to a level of confidence of 97.80 percent. #9794
-
(See Solution) Suppose that the percentage returns for a given year for all stocks listed on the New York Stock Exc #14482
-
(Solved) The Banner Mattress and Furniture Company wishes to study the number of credit applications received #10874
-
Free Math Help
-
Math and Statistics Solutions
 at a restau #9703")
 Find the value of {{z}_{alpha /2}} that corresponds to a level of confidence of 97.80 percent. #9794")
 Suppose that the percentage returns for a given year for all stocks listed on the New York Stock Exc #14482")
 The Banner Mattress and Furniture Company wishes to study the number of credit applications received #10874")

