The following scatter plot was created for two characteristics of a sample of automobiles, weight an
Question: The following scatter plot was created for two characteristics of a sample of automobiles, weight and miles per gallon. After looking at the graph, what can you conclude about the relationship between the two characteristics?
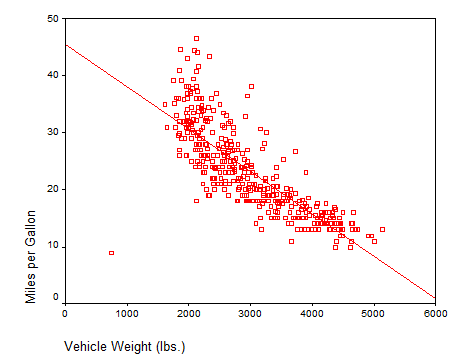
a. The correlation coefficient is approximately +1.
b. The correlation coefficient is approximately -1.
c. The correlation coefficient is approximately 0.
d. One can’t estimate the correlation coefficient from the graph.
Price: $2.99
Solution: The solution consists of 1 page
Deliverables: Word Document
Deliverables: Word Document
-
 Statistics - Other statistics problems #6380
-
(See Solution) Let be a random sample from a population, known. An LRT of versus is a test that rejects if #25361
-
[Solved] The following data were obtained in a study using three separate samples to compare three different #13621
-
[Solved] The table below shows Psychology exam scores, Statistics Exam scores, and IQ scores for a random sam #23864
-
Math Solutions
-
Math and Statistics Solutions

 Let be a random sample from a population, known. An LRT of versus is a test that rejects if #25361")


