The following scatter plot was created for two characteristics of a sample of automobiles, weight an
Question: The following scatter plot was created for two characteristics of a sample of automobiles, weight and miles per gallon. After looking at the graph, what can you conclude about the relationship between the two characteristics?
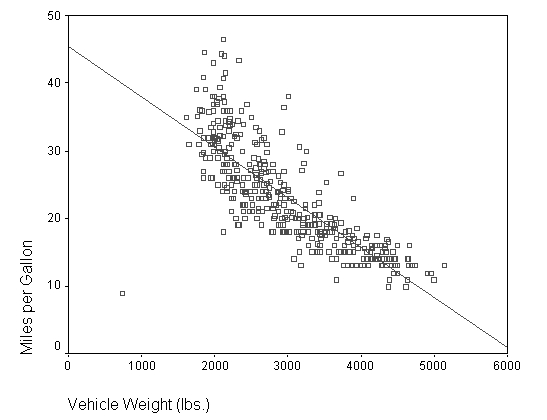
a. The correlation coefficient is approximately +1.
b. The correlation coefficient is approximately -1.
c. The correlation coefficient is approximately 0.
d. One can’t estimate the correlation coefficient from the graph.
Price: $2.99
Solution: The solution consists of 2 pages
Deliverable: Word Document
Deliverable: Word Document
-
 Statistics - Other statistics problems #5005
-
(See Solution) A coach uses a new technique in middle distance runners. The times for 8 different athletes to run 8 #4592
-
(See Solution) The Travel Bureau of Honolulu surveyed a sample of tourists as they left to return to the United Sta #6572
-
[Solved] Type in the data given in the lecture for the distance from the road and the lead concentration (dat #6701
-
Math Solutions
-
Math and Statistics Solutions

 A coach uses a new technique in middle distance runners. The times for 8 different athletes to run 8 #4592")
 The Travel Bureau of Honolulu surveyed a sample of tourists as they left to return to the United Sta #6572")


