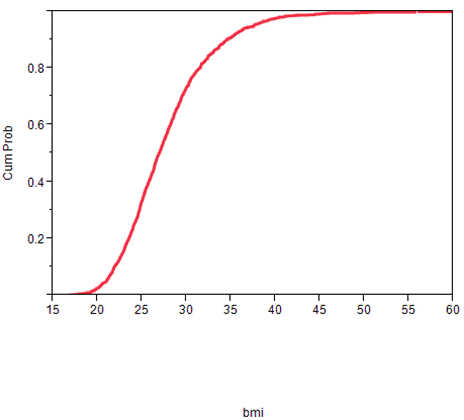
Using the graph of empirical distribution function of BMI of sample participants, please determine i
Question: Using the graph of empirical distribution function of BMI of sample participants, please determine if BMI=55 kg/m2 would be considered an outlier? Justify your answer.
Price: $2.99
Solution: The solution consists of 1 page
Deliverables: Word Document
Deliverables: Word Document
-
. The data file data2_Q5.sav contains information on the percentage of people who brush the #29368") [Solution] (8 marks). The data file data2_Q5.sav contains information on the percentage of people who brush the #29368
[Solution] (8 marks). The data file data2_Q5.sav contains information on the percentage of people who brush the #29368
-
Solution: A sample of n=20 scores has a mean of M=6. If one new person with a score of x=27 is added to the sa #17886
-
[Solved] Define the following a) A statistical significant result b) alpha level c) Type I error d) Type 2 er #18858
-
[Solution] Compute a 95% confidence interval for the population mean, based on the sample 1, 2, 3, 4, 5, 6, and #6386
-
Math Homework Help
-
Math Solved Problems
. The data file data2_Q5.sav contains information on the percentage of people who brush the #29368")

 A statistical significant result b) alpha level c) Type I error d) Type 2 er #18858")


