Use the data from Assignment 1 to answer each of the following questions. For each of the following
Question: Use the data from Assignment 1 to answer each of the following questions.
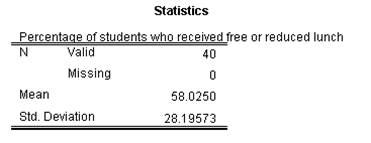
For each of the following values, use the one-tail five percent (5%) criteria and determine if the occurrence of the score would be considered relatively likely or unlikely? (Note: Assume that the researcher is only interested in the extreme low percents of students receiving free or reduced lunch--or the negative end of the normal curve).
a. 8
b. 15
c. 58
Price: $2.99
Solution: The downloadable solution consists of 2 pages
Deliverable: Word Document
Deliverable: Word Document
-
 Use the data from Assignment 1 to answer each of the following questions. For each of the following #17652") (See Solution) Use the data from Assignment 1 to answer each of the following questions. For each of the following #17652
(See Solution) Use the data from Assignment 1 to answer each of the following questions. For each of the following #17652
-
[Solution] Consider the following data on the relationship between seat belt use and emergency room visits. #27208
-
[Solution] In a random sample of eight military contracts involving cost overruns, the following inf #5408
-
(See Solution) A researcher used stepwise regression to create regression models to predict BirthRate (births p #20251
-
Math Solutions
-
Math and Statistics Solutions
 Use the data from Assignment 1 to answer each of the following questions. For each of the following #17652")


 A researcher used stepwise regression to create regression models to predict BirthRate (births p #20251")

