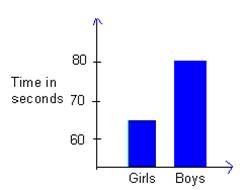
The bar graph below compares the mean time in seconds for 7-yr old girls to complete a certain task
Question: The bar graph below compares the mean time in seconds for 7-yr old girls to complete a certain task to the mean time in seconds for 7-yr old boys to complete the same task. There is a statistical deception here. Explain what is deceptive about the bar graph.
Price: $2.99
See Answer: The downloadable solution consists of 1 page
Deliverables: Word Document
Deliverables: Word Document
-
 [Solved] Following are the speeds of 40 cars clocked by radar on a particular road in a 35-mph zone on a part #15984
-
(See Solution) How productive are employees? One way to answer this question is to study annual company profits per #28956
-
Solution: At age 9 the average weight (21.3kg) and the average height (124.5cm) for both boys and girls are ex #15089
-
[Solution] Use the F table in Appendix D to find the value of F for the upper 5% of the F distribution with #28616
-
Math Homework Help
-
Step-by-Step Math Solutions

 How productive are employees? One way to answer this question is to study annual company profits per #28956")
 and the average height (124.5cm) for both boys and girls are ex #15089")


