Ten samples of size four were taken from a process, and their weights measured. The sample averages
Question: A restaurant manager tracks complaints from the diner satisfaction cards that are turned in at each table. The data collected from the past week's diners appear in the following table.
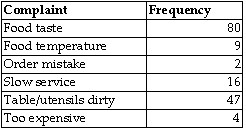
a) Draw a Pareto chart for this data
b) What categories comprise about 20% of the total complaints?
c) On the cumulative curve, there is a point representing cumulative frequency of “slow service” complains. How the value of this point is calculated? Show all steps and numbers.
Price: $2.99
See Solution: The solution consists of 2 pages
Solution Format: Word Document
Solution Format: Word Document
-
 [Solution] Schmidt industries makes four different snake traps; the Harlan, the Gaylen, the Leah, and the Matth #9123
-
(See Solution) The Charm City Manufacturing Company manufactures a product in an assembly line operation. One of th #27095
-
[Solution] Romans food market carries a variety of specialty foods from around the world. Two of the stor’s lea #13784
-
(See Solution) Star Savings and Loan is planning to install a drive-through window. Transaction times at the drive- #18759
-
Math Solutions
-
Step-by-Step Math Solutions

 The Charm City Manufacturing Company manufactures a product in an assembly line operation. One of th #27095")

 Star Savings and Loan is planning to install a drive-through window. Transaction times at the drive- #18759")

