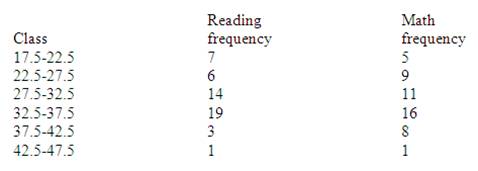
Making the Grade. The frequency distributions shown indicate the percentages of public school studen
Question: Making the Grade. The frequency distributions shown indicate the percentages of public school students in fourth-grade reading and mathematics who performed at or above the required proficiency levels for the 50 states in the United States. Draw histograms for each, and decide if there is any difference in the performance of the students in the subjects.
Price: $2.99
Solution: The answer consists of 3 pages
Type of Deliverable: Word Document
Type of Deliverable: Word Document
-
 Roller Coaster Mania. The World Roller Coaster Census Report lists the following number of roller co #25677") (Solved) Roller Coaster Mania. The World Roller Coaster Census Report lists the following number of roller co #25677
(Solved) Roller Coaster Mania. The World Roller Coaster Census Report lists the following number of roller co #25677
-
[Solved] Find the probability that a random z-score will be greater than 2.5 #1908
-
[Solution] Find the chi-square values that bound the middle 95% of the distribution when n = 10. I need to know #24617
-
[Solved] X has a normal distribution with a mean of 80.0 and a standard deviation of 3.5. Find the following #16479
-
Math Homework Help
-
Math Solutions
 Roller Coaster Mania. The World Roller Coaster Census Report lists the following number of roller co #25677")


