The Minnesota Department of Transportation hoped that they could measure the weights of big trucks w
Question: The Minnesota Department of Transportation hoped that they could measure the weights of big trucks without actually stopping the vehicles by using a newly developed “weight-in-motion” scale. To see if the new device was accurate, they conducted a calibration test. They weighed several trucks when stopped (static weight) assuming that this weight was correct. They the weighed the trucks while they were moving to see how well the new scale could estimate the actual weight.
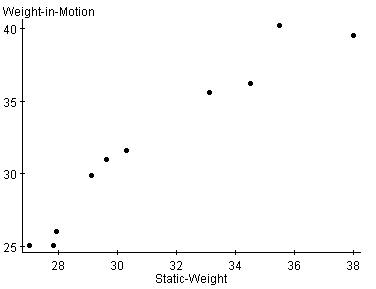
 Scatter Plot
Simple Linear Regression
Simple linear regression results:
Dependent Variable: Weight-in-Motion
Independent Variable: Static-Weight
Weight-in-Motion = -13.668853 + 1.460641 Static-Weight
Sample size: 10
R (correlation coefficient) = 0.9653
R-sq = 0.931764
Estimate of error standard deviation: 1.5751272
Parameter estimates:
| Parameter | Estimate |
| Intercept | -13.668853 |
| Slope | 1.460641 |
a. Looking at the scatterplot of the data, what does it tell you about the relationship between the static weight and the “weight-in-motion”?
b. Find the equation of the least squares line of regression for this data. What does the correlation coefficient tell you about the relationship between the static weight and the “weight-in-motion”?
c. Predict the “weight-in-motion” for a static weight of 32.
d. Are you confident that predictions based on the equation of this least squares line of regression will be quite accurate? Why or why not?
e. What percent of the variation in the “weight-in-motion” can be explained by the regression on
(relationship with) the static weight?
Deliverables: Word Document

-
 On average, the poor travel 20 miles for outpatient care in rural areas. A researcher wishes to test #20219") (Solved) On average, the poor travel 20 miles for outpatient care in rural areas. A researcher wishes to test #20219
(Solved) On average, the poor travel 20 miles for outpatient care in rural areas. A researcher wishes to test #20219
-
(Solved) Use the following information for problems 1-3. Decide whether the normal sampling distribution can #23147
-
(Solved) Samples of four different cereals show the following number of calories for the suggested servings o #115
-
[Solved] FORECASTING (a) The number of cans of soft drinks sold in a machine each week is recorded below. De #11951
-
Free Math Help
-
Math Solved Problems
 On average, the poor travel 20 miles for outpatient care in rural areas. A researcher wishes to test #20219")
 Use the following information for problems 1-3. Decide whether the normal sampling distribution can #23147")
 Samples of four different cereals show the following number of calories for the suggested servings o #115")
 The number of cans of soft drinks sold in a machine each week is recorded below. De #11951")

