The figure below is a histogram for the number of chocolates consumed per week by 500 students. Clas
Question:
The figure below is a histogram for the number of chocolates consumed per week by 500 students. Class intervals include the left -endpoint but not the right, (For example, someone who eats 30 chocolates per week would fall in the 30-40 block not the 20 -30 block) The height of each block is given in parentheses. The block over the 10-20 chocolate interval is missing.
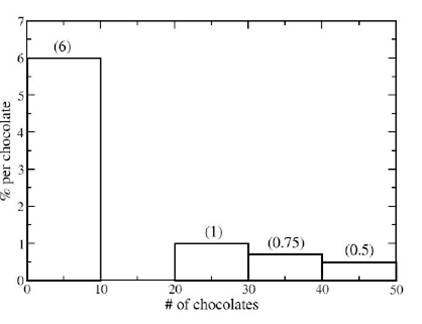
a) What percentage of students fall in the following intervals: 0-10 chocolates? 20-30 chocolates? 30- 40 chocolates? 40-50 chocolates?
b) The block over the 10 -20 chocolate interval is missing. How tall must it be?
c) What is the median number of chocolates?
d) What is the mean number of chocolates?
e) Assuming an even distribution throughout the intervals, what percentage of the students reported eating 35 chocolates per week?
f) The maximum possible answer on the survey used to collect this data was 50 chocolates. But suppose that some of the students who answered 50 would have answered higher (all the way up 80) if given the option. If those students could change their answers to values greater than 50, how would that affect the mean, the median and the standard deviation? For each of the mean, the median, and the standard deviation will it increase, decrease or stay the saMeand why will each have that behaviour?
g) If everyone that said they were eating 30 or more chocolates per week, quit eating chocolates entirely, the 30-40 and 40 -50 blocks would disappear and the 0 -10 block would increase in height. How high would the new 0 -10 block be?
According to our survey data, the histogram for the weights of 630 college a g ed women is close to the normal distribution curve with an average of 62 kilograms and a standard deviation of 11 kilograms.
h) Within what range of weights (kg) do 95% of the women fall?
i) How many women weighed between 51 kilograms and 84 kilograms when this data was collected?
Deliverables: Word Document

-
 Provide an appropriate response. The confidence interval, 4.83 < ? < 7.00, for the population standa #17369") (Solved) Provide an appropriate response. The confidence interval, 4.83 < ? < 7.00, for the population standa #17369
(Solved) Provide an appropriate response. The confidence interval, 4.83 < ? < 7.00, for the population standa #17369
-
[Solution] Find p#770; and q#770; for a study of 130 adult smokers, 60 of whom have attempted to quit smok #809
-
Solution: Explain in your own words what is the statistical power of a hypothesis test and what does a more po #68
-
Solution: Chinese students from public schools in Hong Kong were the subjects of a study designed to investiga #5706
-
Math Help
-
Math and Statistics Solutions
 Provide an appropriate response. The confidence interval, 4.83 < ? < 7.00, for the population standa #17369")


