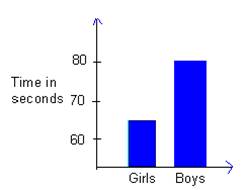
The bar graph below compares the mean time in seconds for 7-yr old girls to complete a certain task
Question: The bar graph below compares the mean time in seconds for 7-yr old girls to complete a certain task to the mean time in seconds for 7-yr old boys to complete the same task. There is a statistical deception here. Explain what is deceptive about the bar graph.
Price: $2.99
Solution: The solution consists of 1 page
Deliverables: Word Document
Deliverables: Word Document
-
 [Solved] A medical researcher believes the number of ear infections in swimmers can be reduced if the swim #1324
-
(Solved) The inmates at Bigmac Prison, Oklahoma, make an average of 437 license plates per day. The warden fe #13444
-
(See Solution) Demand for a product is normal, with mean being 400 and standard deviation being 25 units. Find a) P #6720
-
Solution: What is the maximum error of estimate? For ?=0.10, a sample size of 36 and standard deviation 6, fin #7768
-
Math Help
-
Math and Statistics Solutions

 The inmates at Bigmac Prison, Oklahoma, make an average of 437 license plates per day. The warden fe #13444")
 Demand for a product is normal, with mean being 400 and standard deviation being 25 units. Find a) P #6720")


