The average January minimum temperature (°F) for 15 selected US cities is shown in the table along w
Question: The average January minimum temperature (°F) for 15 selected US cities is shown in the table along with the city's latitude and longitude coordinates in degrees.
| City | A 'vg Temp | Latitude | Longitude | City | Avg Temp | Latitude | Longitude |
| Albany. NY | 14 | 42,6 | 73,7 | Miami, FL | 58 | 26.3 | 80.7 |
| Bismarck. ND | 0 | 47.1 | 101 | Mobile, AL | 44 | 31.2 | 88.5 |
| Boise. ID | . 21 | 4,3,7 | 117_1 | Phoenix. AZ | 35 | 33.6 | 11/.5 |
| Baskin, MA | 23 | 4/.7 | 71.4 | Portland. OR | 33 | 45.6 | 123.2 |
| Denver. CO | 15 | 40.7 | 105.3 | Seattle. WA | 33 | 48.1 | 112.5 |
| Houston, TX | 44 | 30,1 | 95.9 | Salt Lake City. UT | 18 | 41.1 | 112.3 |
| Los Angeles, CA | 47 | 34.3 | 118.7 | Wilmington, DE | 26 | 40.5 | 76.3 |
| Milwaukee, WI | 13 | 43.3 | 88.1 |
Meteorologists want to determine if there is a relationship between the temperature and either the city's latitude or longitude.
Scatter plots for both relationships are shown along with the equation for the least squares regression line.
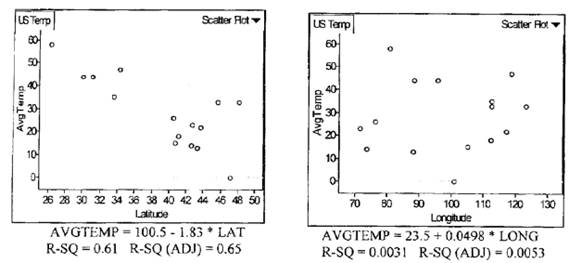
(A) Which plot shows a stronger relationship between Average Temperature and map location? Explain your reasoning.
(B) What is the value of the correlation coefficient for Latitude and AvgTemp?
(C) Chicago. IL is at 42.3° latitude and 88° longitude. Predict the average January minimum temperature. Show your work.
(D) What is the residual for Longitude and AvgTemp for Denver, CO)? Show your work.
Deliverable: Word Document

-
 [Solved] The administrators of a large hospital installed new drink vending machines in the cafeteria and mai #12403
-
[Solved] Dr Arnold Schwarzenegger, a local traffic engineer with the Municipality of Anchorage (MOA) wants to #19998
-
[Solution] A telephone survey gives 377 consumers two choices: Do they prefer Coke or Pepsi? Exactly 79 of thos #17604
-
[Solution] Given a standard normal distribution (with a mean of μ =0 and a standard deviation of σ = #6627
-
Math Homework Help
-
Math and Statistics Answers

 wants to #19998")


