Miles per Gallon Elena conducts an experiment in which she fills up the gas tank on her Toyota Camry
Question: Miles per Gallon Elena conducts an experiment in which she fills up the gas tank on her Toyota Camry 40 times and records the miles per gallon for each fill-up. A histogram of the miles per gallon indicates that a normal distribution with mean of 24.6 miles per gallon and a standard deviation of 3.2 miles per gallon could be used to model the gas mileage for her car.
|
|
|
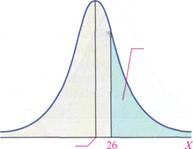
Area = 0.3309 |
(a) The following figure represents the normal curve with ![]() = 24.6 miles per gallon and
= 24.6 miles per gallon and![]() = 3.2 miles per gallon. The area under the curve to the right of X = 26 is 0.3309. Provide two interpretations of this area.
= 3.2 miles per gallon. The area under the curve to the right of X = 26 is 0.3309. Provide two interpretations of this area.
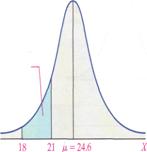
(b) The following figure represents the normal curve with![]() = 24.6 miles per gallon and
= 24.6 miles per gallon and ![]() = 3.2 miles per gallon. The area under the curve between 18 and 21 is 0.1107. Provide two interpretations of this area.
= 3.2 miles per gallon. The area under the curve between 18 and 21 is 0.1107. Provide two interpretations of this area.
Deliverables: Word Document

-
 Look over the expenditure categories that the CEO gave you. Would you expect an interaction between #21341") (Solved) Look over the expenditure categories that the CEO gave you. Would you expect an interaction between #21341
(Solved) Look over the expenditure categories that the CEO gave you. Would you expect an interaction between #21341
-
[Solution] A University Counseling Clinic is interested in predicting the levels of depression from the number #17484
-
[Solved] Weights of Supermodels. Supermodels are sometimes criticized on the grounds that their low weights e #19945
-
[Solved] The average annual salary of major league baseball players is now $1,789,556. Suppose this year a ra #839
-
Math Help
-
Math Solutions
 Look over the expenditure categories that the CEO gave you. Would you expect an interaction between #21341")


