A researcher is investigating possible explanations for deaths in traffic accidents. He examined dat
Question: A researcher is investigating possible explanations for deaths in traffic accidents. He examined data from 1991 for each of the 50 states plus Washington, D.C. The data included information on the following variables:
Deaths: The number of deaths in traffic accidents
Income: The average income per family
Children: The number of children (in multiples of 100,000) between the ages of 1 and 14 in the state
As part of his investigation he ran the following multiple regression model:
where the deviations \({{\varepsilon }_{i}}\) were assumed to be independent and Normally distributed with mean 0 and standard deviation σ. This model was fit to the data using the method of least squares. The following results were obtained from statistical software:
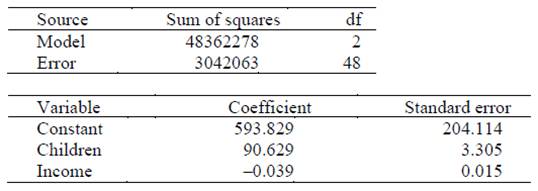
a) Suppose we wish to test the hypotheses H0: β1 = β2 = 0 versus Ha: at least one of the
βj is not 0 using the ANOVA F test. What is the value of the F statistic?
b) What can we say about the P-value for the ANOVA F test?
c) What is a 99% confidence interval for β2, the coefficient of the variable income? Show work.
d) What proportion of the variation in the variable deaths is explained by the explanatory variables children and income? Explain.
Type of Deliverable: Word Document

-
 [Solved] Data were obtained in a study of the oxygen uptake of 31 middle-aged-males and females while exercis #29071
-
[Solution] A common concern for students (and teachers) is the assignment of grades for essays or term papers. #27414
-
[Solved] An Account temps survey of 150 executives showed that 44% of them say that “little or no knowledge o #4580
-
[Solved] A study was conducted in young adults to look at the association between taking a driver’s education #19883
-
Math Help
-
Math Solved Problems

 is the assignment of grades for essays or term papers. #27414")


