Solution) In a sample 80 workers from a factory in city A, it was found that 5% were unable to read, while in
Question: In a sample 80 workers from a factory in city A, it was found that 5% were unable to read, while in a sample of 50 workers in city B, 8% were unable to read. Can it be concluded that there is a difference in the proportions of nonreaders in the two cities? Use a = 0.10. Find the 90% confidence interval for the difference of the two proportions.
Solution: (a) We want to test the following null and alternative hypotheses:
We need to use a z-test for proportions. The level of significance is set at![]() . From the information provided, we have that
. From the information provided, we have that
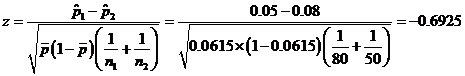
and also, the pooled proportion is
With this information, the z-statistics is computed as
The critical value for![]() for this test is
for this test is![]() . The rejection region is given by
. The rejection region is given by
Since![]() , then we fail to reject the null hypothesis H0.
, then we fail to reject the null hypothesis H0.
Hence, we don't have enough evidence to support the claim that there is a difference in the proportions of nonreaders in the two cities.
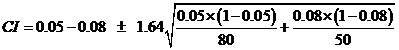
(b) The 90% confidence interval for![]() is computed as
is computed as

Based on the information provided, we get that
The confidence interval is given by:
This means we are 90% confident that the interval![]() contains the actual value of
contains the actual value of![]() .
.
Deliverable: Word Document

-
 [Solved] What are population, sample and sampling distributions? #22620
-
[Solved] Tell me what is statistically wrong with all of these statements. The probability that it keeps snow #29097
-
Statistics - Confidence intervals #22619
-
[Solution] The manager of the purchasing department of a large banking organization would like to develop a mod #6225
-
Math Help
-
Math Solutions


