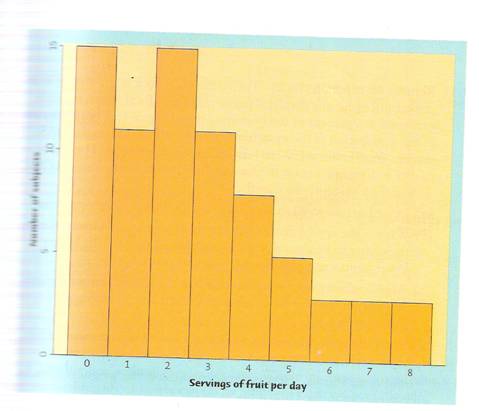
Figure 1.10 (below) is a histogram of the number of servings of fruit per day claimed by 74 sevente
Question: Figure 1.10 (below) is a histogram of the number of servings of fruit per day claimed by 74 seventeen-year old girls in a study. Describe the shape, center, and spread of the distribution. What percent of these girls ate fewer than two servings per day?
Price: $2.99
Answer: The solution consists of 1 page
Solution Format: Word Document
Solution Format: Word Document
-
 Back-to-Back Stemplot: Here are Mark McGwire’s homerun counts for 1987-2001: 49, 32, 33, 39, 22, 42 #1663") (Solved) Back-to-Back Stemplot: Here are Mark McGwire’s homerun counts for 1987-2001: 49, 32, 33, 39, 22, 42 #1663
(Solved) Back-to-Back Stemplot: Here are Mark McGwire’s homerun counts for 1987-2001: 49, 32, 33, 39, 22, 42 #1663
-
(See Solution) Have each person in class take his or her pulse and determine the heart rate (beats in one minut #24762
-
[Solved] Item 5: What do/may Type I and Type II errors have to do with the type of test you might conduct (up #13776
-
[Solution] The following population data for a market research study identifying the number of hours of televis #3468
-
Free Math Help
-
Step-by-Step Math Solutions
 Back-to-Back Stemplot: Here are Mark McGwire’s homerun counts for 1987-2001: 49, 32, 33, 39, 22, 42 #1663")
 Have each person in class take his or her pulse and determine the heart rate (beats in one minut #24762")


