The sales, in billions of dollars, of Keller Overhead Door, Inc. for 1995 to 2000 are: a. Plot the
Question: The sales, in billions of dollars, of Keller Overhead Door, Inc. for 1995 to 2000 are:
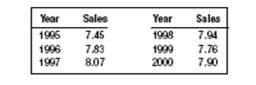
a. Plot the data.
b. Determine the least squares trend equation.
c. Use the trend equation to calculate the points for 1997 and 1999. Plot them on the graph and
draw the regression line.
d. Estimate the net sales for 2003.
e. By how much have sales increased (or decreased) per year on the average during the period?
Price: $2.99
Solution: The solution consists of 3 pages
Deliverables: Word Document
Deliverables: Word Document
-
 On the blueprint of a house, 36 millimeters represents 7 meters. If the length of the li #6117") (Solved) On the blueprint of a house, 36 millimeters represents 7 meters. If the length of the li #6117
(Solved) On the blueprint of a house, 36 millimeters represents 7 meters. If the length of the li #6117
-
(See Solution) The question arose as to whether gender might be an effect modifier of this association. When gender #19884
-
(See Solution) Langewitz, Izakovic, and Wyler (2005) reported that self-hypnosis can significantly reduce hay fever #20566
-
Solution: What percent of the population lies below Q3? #29093
-
Math and Statistics Calculator
-
Math and Statistics Answers
 On the blueprint of a house, 36 millimeters represents 7 meters. If the length of the li #6117")
 The question arose as to whether gender might be an effect modifier of this association. When gender #19884")
 Langewitz, Izakovic, and Wyler (2005) reported that self-hypnosis can significantly reduce hay fever #20566")


