[Answer] As in the past, your homework solutions should consist - #80155
Stat 601
Regression Analysis Homework Assignment
As in the past, your homework solutions should consist of a single Word document that you submit via Vista. Your filename should include the last name of the student(s) submitting the problem set, and a ‘Homework 3’ identifier, as in ‘Jones_Smith HW 3’. Do not use special characters such as the “#” sign in your filename.
You may work this problem alone or you may work in a group of up to four students. If you work in a group: (1) choose a single student in the group and submit the assignment under that student’s name; and (2) the remaining students in the group should submit for their assignment a simple statement such as “I worked in the group with Bob and Jane.” This facilitates my returning the graded assignment to all group members.
You will be penalized if your submission is not well-organized and easy to follow. Make sure that problems are submitted in order. ‘Cut and paste’ relevant computer results into your solutions (do NOT attach them at the end as an appendix). Don’t just report final answers: make sure that I have enough info to understand how you answer was obtained (again, a Minitab/Excel printout is fine). For hypothesis test problems, be sure to start with a statement of the null and alternative hypothesis; show the work involved in reaching a conclusion, and interpret that conclusion in the context of the problem. It’s not enough to say ‘reject H0’. What does that mean in the situation of interest?
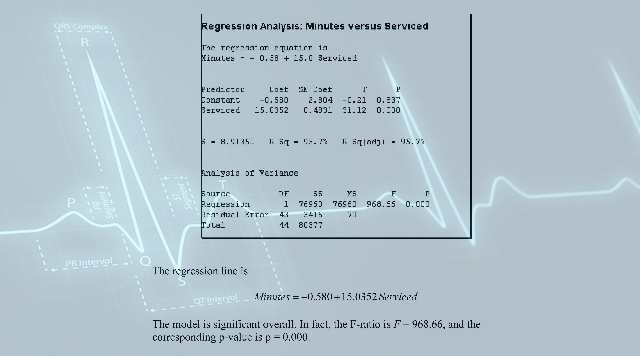
1. (Data source: Applied Linear Statistical Models, 5th Ed., by Kutner, Nachtsheim, Neter, and Li, McGraw-Hill, 2005) An office equipment corporation performs preventive maintenance and repair on the line of copies that it sells. For 45 recent service calls data has been collected on the number of copiers serviced during the call and the number of minutes spent on the call by the service person. The company would like to develop a regression model that can be used to predict the amount of time (in minutes) that a call will require based on the number of copies that need to be serviced.
(a) Find the equation for the estimated least-squares regression line. Report your fitted equation along with t-stats, the F-stat, R-squared values and ANOVA table. (For example paste in a Minitab regression printout from the beginning through the ANOVA table.) Then plot both the data points and the sample regression line on the same plot.
(b) Plot the residuals vs. fitted values. Based on the plot, do you believe that the assumptions of the regression model hold? Is the model a good fit?
(c) Perform a formal test to check the assumption of normally distributed error terms. Use level of significance α = 0.05.
(d) Test for a significant linear relation. In other words, does the data provide evidence of a relation between the time spent on a call and the number of copiers serviced? Use level of significance α = 0.05. Perform the test using both a critical value approach and a p-value approach.
(e) Interpret the value of the sample slope in the context of this problem.
(f) Find a 95% confidence interval for the population slope.
(g) Report and interpret the value of the coefficient of determination R2. Also calculate the value of the correlation coefficient r.
(h) Find a 95% confidence interval for the mean time spent on service calls for calls that involve 7 copiers.
(i) (i) The first service call scheduled for tomorrow involves servicing 5 copiers. Predict, with a .95 probability of being correct, the time that will be required for this service call.
(ii) Report (i) but now assume that the call involves servicing 13 copiers rather than 5 copiers.
(iii) What key assumption is made when doing the prediction requested in (ii) that is not necessary for the prediction requested in (i)?
2. Text Problem 14.71 Parts (a)
Data file COLLEGES2002 contains data on 80 colleges. Among the variables included are the annual total cost (in thousands of $), the first-quartile (q1) and third quartile (q3) score on the SAT, and the room and board expenses (in thousands of $). Develop a model to predict the annual total cost based on first quartile SAT score and room and board expenses.
a) State the multiple regression equation.
b) Interpret the meaning of the slopes in this equation.
c) Predict the annual total cost for a school that has a q1 SAT score of 1100 and a room and board expense of $5000.
d) Perform a residual analysis on the results and determine the adequacy of the model.
e) Is there a significant relationship between annual total cost and te two independent variables (q1 SAT and room and board exp) at the .05 level of significance?
3. Data file AUTO2002 contains data on 121 automobile models from 2002 and is described in Problem 15.30, page 646 of your text. I’m including an expanded version of AUTO2002 with the assignment. Let’s have some ‘fun’ with this data set!
(a) Assume that there is a quadratic relationship between the variables MPG (dependent variable) and Weight. Find the fitted quadratic regression equation (fit MPG vs. Weight and Weight-Squared). Report your fitted equation along with t-stats, the F-stat, R-squared values and ANOVA table. (For example paste in a Minitab regression printout from the beginning through the ANOVA table.) The plot the data (MPG vs. Weight) and the fitted quadratic regression equation.
(b) Is the quadratic regression relation significant? Test at the α = 0.05 level of significance.
(c) Plot the residuals vs. the fitted values. Based on the plot, do you think that the model is a good fit? Do the assumptions made in regression analysis appear to hold?
(d) Let’s classify a case (in this case a car) as an outlier if its deleted residual (TRES) value is greater than 2.5 in absolute value. Which cars, if any, are outliers? What are their TRES values? (Please do not paste a complete list of all 121 TRES or other values into your assignment!) Are they outliers because they get higher than normal mileage or lower than normal mileage?
(e) Which cars, if any, are high leverage values? In answering, be sure to show the cutoff that you are using to determine ‘high leverage’.
(f) Which cars, if any, represent influential observations? In answering, be sure to show the cutoff that you are using to determine ‘influential’.
(g) Remove any influential observations found in (f) from the data set and re-fit the quadratic relation. For the remaining parts of this problem, work with this reduced data set! Once again report your results from fitted regression equation through ANOVA table.
(h) Let’s fit an expanded model: MPG vs. Weight, Weight-Squared, Horsepower, Cargo Volume, and SUVCode. Note that SUVCode is a ‘dummy’ variable. The variable ‘SUV’ is qualitative and cannot be used in a regression analysis. The SUVCode variable is equal to one if a vehicle is an SUV, zero otherwise. Since this is quantitative, we can incorporate it into the analysis. You can read more about dummy variables on pages 592-594 if you’re interested.
Once again report your results from fitted regression equation through ANOVA table.
(i) Use the expanded model to predict, with a .95 probability of being correct, the MPG of a 3,300 pound sedan with 230 horsepower and a cargo volume of 12 cubic feet.
(j) Does the expanded model have more explanatory power than the original quadratic model from (a)? Or, could we drop the three additional variables with no real loss? Set up and perform a single appropriate test at the α = 0.05 level of significance.
(k) Is the dummy variable ‘SUVCode’ a significant variable in the expanded model? Set up and perform an appropriate test at the α = 0.05 level of significance. Base your decision rule/conclusion on critical values rather than p-values.
Deliverable: Word Document
 and pdf
 according to the least expensive method for each task. - #80079")


