(Answer) 1) Construct a frequency distribution and a histogram - #80119
Please use information on page 2-3 to work problems.
1) Construct a frequency distribution and a histogram for the variables, "Age" and "Number of Miles to Class 1-Way". Comment on the general shape of the graph. Is it like a normal curve (bell-shaped)? Or is it skewed in some way? Do the same analysis on the "Number of Miles to Class 1-Way".
2) Compute Descriptive Statistics for each variable of this class data for which this makes sense: age, miles, minutes, number of credit hours taking this semester, number of hours worked per week, and number of meals purchased outside the home. Show all your work.
3) Determine the percentage of people in the class who are male vs. female, married vs. single, prefer diet soft drinks, and prefer each of the four types of restaurants. Do this using either Excel or by hand. Or better yet, create a Pie chart for each and have Excel enter the label and percentage.
4) "Describe this class"
Using the graphs and descriptive statistics produced in 1), 2), and 3) above, describe this class in words. Write at least two pages doubled spaced. Include observations gleaned from the information produced using Excel. Discuss each of the ten variables (age, miles, etc.) used in the database. What can you generalize about the class?
Deliverable: Word Document
 and pdf
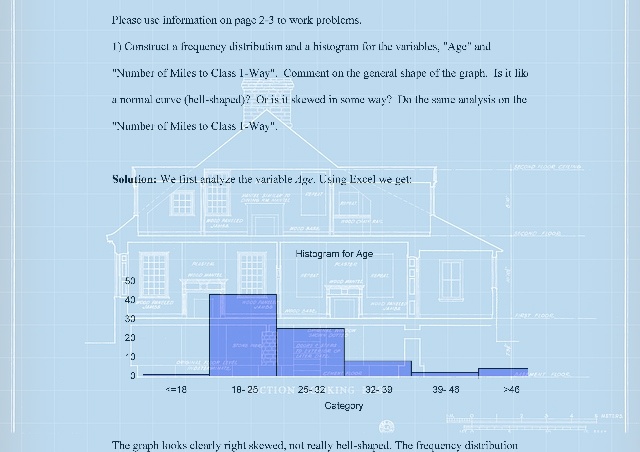

 John S. Mill recently received a research-oriented master’s - #80060")


