Solution: How well does a child’s height at age 6 predict height - #80042
Problem 1:
(10pts)How well does a child’s height at age 6 predict height at age 16? To find out, you measure the heights of a large group of children at age 6, wait until they reach age 16, then measure their heights again.
(a) What are the explanatory and response variables here?
(b) Are these variables categorical or quantitative?
Problem 2:
(15pts)When interest rates are high, investors may shun stocks because they can get high returns with less risk. The figure below shows the annual return on U.S. common stocks for the years 1950 to 2000 against the returns on Treasury bills for the same years. (The interest rate paid by Treasury bills is a measure of how high interest rates were that year.)
(a) (5pts) Approximately what were the highest and lowest annual percent returns on stocks during this period?
(b) (5pts) What were the highest and lowest returns for Treasury bills?
(c) (5pts) Describe the pattern you see. Are high interest rates bad for stocks? Is the relationship between interest rates and stock returns strong or weak?
Problem 3:
(15pts)Table 1.9 (attached) on page 39 of your textbook (Introduction to the Practice of Statistics, by Moore et. al. 5th edition) (table 1.6 if you are using the 4th edition) reports data on 78 seventh-grade students (OBS, GPA, IQ, Gender, Self-concept). Some people think that self-concept is related to school performance.
(a) (10pts) Use Excel to make a scatterplot of school GPA against self-concept score.
(b) (5pts) Describe the overall pattern that you see. Does it make sense to use the correlation as a summary?
(c) (10pts) Using Excel (correl or data analysis-correlation), find the correlation coefficient, r, and interpret its value in words (strong or weak, positive or negative association, any other comment?)
Problem 4:
(10pts)Use Excel for these questions-
Here is a Table (attached) showing the lean body mass (in kg) and resting metabolic rate (in calories burned per 24 hours) for 12 women and 7 men. Researchers believe that lean body mass is an important influence on metabolic rate.
(a) (4pts) Make a scatterplot of the data (metabolism rate vs lean body mass), using different symbols or colors for men and women.
(b) (3pts) Use Excel to find the correlation coefficient, r, between lean body mass and metabolism rate for the whole group (males and females together).
(c) (3pts) Use Excel to find the correlation coefficients separately in each sex. Which one is stronger?
Deliverable: Word Document
 and pdf
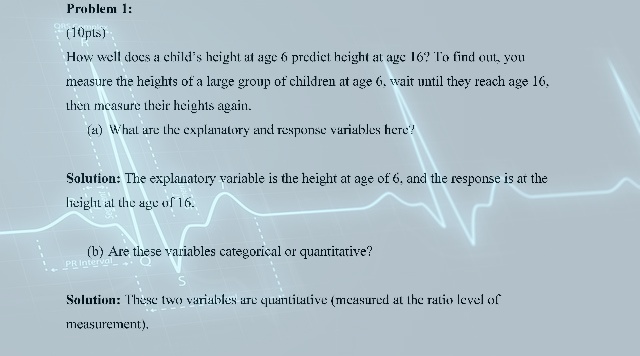

 Consider yourself a policy analyst at the Ministry of - #80009")

 This lab assignment is to analyze a current events article - #80075")
