Outlier Calculator
Instructions: Use this outlier calculator by entering your sample data. This calculator will show you all the steps to apply the "1.5 x IQR" rule to detect outliers. These outliers will be shown in a box plot. Please press enter your sample below:
Outlier Calculator and How to Detect Outliers
What is an outlier?
An outlier is a value in a sample that too extreme. Such definition begs to be more precise: What do we mean for being "too extreme"? There are diverse interpretations of this notion of being too extreme.
One common rule to decide whether a value in a sample is too extreme is whether or not the value is beyond 1.5 times the Interquartile Range from the first or third quartiles
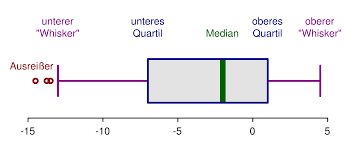
This outlier calculator will show you all the steps and work required to detect the outliers: First, the quartiles will be computed, and then the interquartile range will be used to assess the threshold points used in the lower and upper tail for outliers.
How do you calculate outliers?
What is the Outlier formula? Well, mathematically, a value \(X\) in a sample is an outlier if:
\[X < Q_1 - 1.5 \times IQR \, \text{ or } \, X > Q_3 + 1.5 \times IQR\]where \(Q_1\) is the first quartile, \(Q_3\) is the third quartile, and \(IQR = Q_3 - Q_1\)
Why are Outliers Important?
Outliers need to be analyzed because their presence may invalidate the results of many statistical procedures. Outliers also need to be analyzed because often times they arise due to typing errors.
Outlier detection is crucial, because if a clear outlier is not detected and eliminated, the value test statistic will likely by off a margin, which could absolutely lead to wrong conclusions.
So, if outliers are not detected and corrected:
- A wrong depiction of the distribution may be given
- A distorted value of measures of central tendency and dispersion.
- The test may lead to a wrong conclusion (often times the incorrect rejection of the null hypothesis
Other descriptive Statistics Calculator
Get a complete calculation with our full descriptive statistics calculator . Or you may also want to use our interquartile calculator , which is directly used in the detection of outliers. Indeed, outliers are typically computed using the rule commonly known as the "1.5 times IQR" rule.
Also, sometimes outliers are computed using z-scores, where any raw score with a z-score that has an absolute absolute greater than 2 is an outlier.
Example: Outlier Detection
Question : Consider the following sample data: 10, 10, 8, 9, 12, 34, 23, 22, 11, 1, 1, 1, 2, 3, 5, 14, 12, 12, 45. Detect the existence of outliers, if any.
Solution:
We need to compute the interquartile range (IQR) for the sample provided. In this case, the sample size is \(n = 19\). These are the sample data that have been provided:
| Observation: | \(X\) |
| 1 | 10 |
| 2 | 10 |
| 3 | 8 |
| 4 | 9 |
| 5 | 12 |
| 6 | 34 |
| 7 | 23 |
| 8 | 22 |
| 9 | 11 |
| 10 | 1 |
| 11 | 1 |
| 12 | 1 |
| 13 | 2 |
| 14 | 3 |
| 15 | 5 |
| 16 | 14 |
| 17 | 12 |
| 18 | 12 |
| 19 | 45 |
Now, in order to compute the quartiles, the data needs to be put into ascending order, as shown in the table below
| Position | X (Asc. Order) |
| 1 | 1 |
| 2 | 1 |
| 3 | 1 |
| 4 | 2 |
| 5 | 3 |
| 6 | 5 |
| 7 | 8 |
| 8 | 9 |
| 9 | 10 |
| 10 | 10 |
| 11 | 11 |
| 12 | 12 |
| 13 | 12 |
| 14 | 12 |
| 15 | 14 |
| 16 | 22 |
| 17 | 23 |
| 18 | 34 |
| 19 | 45 |
Quartiles
![]() For \(Q_1\) we have to compute the following position:
For \(Q_1\) we have to compute the following position:
Since \(5\) is an integer number, \(Q_1\) is computed by simply locating the value that is the the \(5^{th}\) position in the table with data in ascending order, which means that in this case
\[Q_1 = 5\]
![]() For \(Q_3\) we have to compute the following position:
For \(Q_3\) we have to compute the following position:
Since (15\) is an integer number, \(Q_3\) is computed by locating the value that is the the \(15^{th}\) position in the table with data in ascending order, which means that in this case
\[Q_3 = 22\]Therefore, the interquartile range (IQR) is
\[ \begin{array}{ccl} IQR & = & Q_3 - Q_1 \\\\ \\\\ & = & 22 - 5 \\\\ \\\\ & = & 17 \end{array}\]Now, we can compute the lower and upper limits for values that will be considered as outliers:
\[Lower = Q_1 - 1.5 \times IQR = 5 - 1.5 \times 17 = -20.5 \]\[Upper = Q_3 + 1.5 \times IQR = 22 + 1.5 \times 17 = 47.5 \]and then, an outcome \(X\) is an outlier if \(X < -20.5\), or if \(X > 47.5\).
![]() The conclusion in this case since all the outcomes \(X\) are within the values of \(Lower = -20.5\) and \(Upper = 47.5\),
then
there are no outliers
.
The conclusion in this case since all the outcomes \(X\) are within the values of \(Lower = -20.5\) and \(Upper = 47.5\),
then
there are no outliers
.


