Normal Probability Plot Maker
Instructions: Use this Normal Probability Plot maker by entering the sample data below and this statistics calculator will provide step-by-step calculation of the required elements to construct the required probability plot.
More About the Normal Probability Plot
A normal probability plot is a plot that is typically used to assess the normality of the distribution to which the passed sample data belongs to.
There are different types of normality plots (P-P, Q-Q and other varieties), but they all operate based on the same idea. The theoretical quantiles of a standard normal distribution are graphed against the observed quantiles.
Therefore, if the sample data comes from a normality distributed population , then the normal probability plot should look like a 45 o line, with random variations about it. If that is not the case, and the pattern of the normal probability plot departs significantly/systematically from the normal probability plot, then one should suspect that the distribution is not normal.
How do you compute a normal probability plot?
There are several concrete steps you need to take, in a specific order to construct a normal probability plot
- In this concrete case, the data are ordered in ascending order, and we call such data as \(X_1, X_2, ...., X_i , ...., X_n\).
- For each \(X_i\) in this sequence of ordered data, we compute the theoretical frequencies \(f_i\), which are approximated using the following formula: \[ f_i = \frac{i - 0.375}{n + 0.25} \] (where \(i\) corresponds to the position in the ordered dataset)
- We then we also compute \(z_i\), is corresponding associated z-score as \[ z_i = \Phi^{-1}(f_i)\]
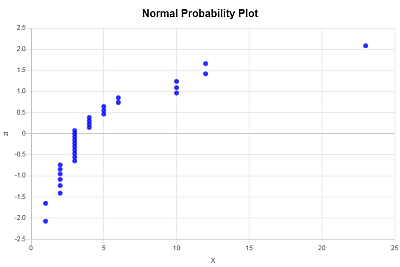
- Then, the normal probability plot is obtained by plotting the ordered X-values (your sample data) on the horizontal axis, and the corresponding \(z_i\) values on your vertical axis.
Normal probability plot Excel
You can plot a normal probability graph in Excel, but it takes some time. Yo
Calculators for the normal distribution and others
Other chart makers you can use are our normal distribution grapher , scatter plot maker or our Pareto chart maker .
Example: Calculation of a normal probability plot
Question : You are provided with the following sample data: 2, 3, 4, 3, 3, 2, 3, 4, 5, 3, 2, 3, 1, 2, 3, 4, 5, 6, 3, 2, 4, 5, 6 10 10 10 12 12 1 2 3 3 and 23. Construct a normal probability plot.
Solution:
We need to construct a normal probability plot. These are the sample data that have been provided:
| Observation: | \(X\) |
| 1 | 2 |
| 2 | 3 |
| 3 | 4 |
| 4 | 3 |
| 5 | 3 |
| 6 | 2 |
| 7 | 3 |
| 8 | 4 |
| 9 | 5 |
| 10 | 3 |
| 11 | 2 |
| 12 | 3 |
| 13 | 1 |
| 14 | 2 |
| 15 | 3 |
| 16 | 4 |
| 17 | 5 |
| 18 | 6 |
| 19 | 3 |
| 20 | 2 |
| 21 | 4 |
| 22 | 5 |
| 23 | 6 |
| 24 | 10 |
| 25 | 10 |
| 26 | 10 |
| 27 | 12 |
| 28 | 12 |
| 29 | 1 |
| 30 | 2 |
| 31 | 3 |
| 32 | 3 |
| 33 | 23 |
The theoretical frequencies \(f_i\) need to be computed as well as the associated z-scores \(z_i\), for \(i = 1, 2, ..., 33\):
Observe that the theoretical frequencies \(f_i\) are approximated using the following formula:
\[ f_i = \frac{i - 0.375}{n + 0.25} \]where \(i\) corresponds to the position in the ordered dataset, and \(z_i\) is corresponding associated z-score. This iscomputed as
\[ z_i = \Phi^{-1}(f_i)\]The following table is obtained
| Position (i) | X (Asc. Order) | f i | z i |
| 1 | 1 | 0.0188 | -2.079 |
| 2 | 1 | 0.0489 | -1.656 |
| 3 | 2 | 0.0789 | -1.412 |
| 4 | 2 | 0.109 | -1.232 |
| 5 | 2 | 0.1391 | -1.084 |
| 6 | 2 | 0.1692 | -0.957 |
| 7 | 2 | 0.1992 | -0.844 |
| 8 | 2 | 0.2293 | -0.741 |
| 9 | 3 | 0.2594 | -0.645 |
| 10 | 3 | 0.2895 | -0.555 |
| 11 | 3 | 0.3195 | -0.469 |
| 12 | 3 | 0.3496 | -0.386 |
| 13 | 3 | 0.3797 | -0.306 |
| 14 | 3 | 0.4098 | -0.228 |
| 15 | 3 | 0.4398 | -0.151 |
| 16 | 3 | 0.4699 | -0.075 |
| 17 | 3 | 0.5 | 0 |
| 18 | 3 | 0.5301 | 0.075 |
| 19 | 4 | 0.5602 | 0.151 |
| 20 | 4 | 0.5902 | 0.228 |
| 21 | 4 | 0.6203 | 0.306 |
| 22 | 4 | 0.6504 | 0.386 |
| 23 | 5 | 0.6805 | 0.469 |
| 24 | 5 | 0.7105 | 0.555 |
| 25 | 5 | 0.7406 | 0.645 |
| 26 | 6 | 0.7707 | 0.741 |
| 27 | 6 | 0.8008 | 0.844 |
| 28 | 10 | 0.8308 | 0.957 |
| 29 | 10 | 0.8609 | 1.084 |
| 30 | 10 | 0.891 | 1.232 |
| 31 | 12 | 0.9211 | 1.412 |
| 32 | 12 | 0.9511 | 1.656 |
| 33 | 23 | 0.9812 | 2.079 |
The normal probability plot is obtained by plotting the X-values (your sample data) on the horizontal axis, and the corresponding \(z_i\) values on your vertical axis. The following normality plot is obtained: